- What is a Digital Annual Report?
- Types of Digital Annual Reports:
- How to Create a Digital Annual Report
- Tips for making an impactful Annual Report
- FAQs:
There has been a shift to bringing the annual reports online over the past few years. With the growing trend of online accessibility and interactivity, digital reports allow you to reach a wider audience while showcasing your creativity.
What is a Digital Annual Report?
A digital annual report is an online version of a company or organization’s yearly report that provides a detailed overview of its financial performance, achievements, and goals. With digital formats, companies can highlight their successes, values, and culture in a way that builds their brand identity.
Unlike traditional printed reports, digital ones don’t have to be long and boring. They can include links, pictures, videos, and even interactive features to make them more engaging. Another big advantage is that digital reports can be accessed anytime, anywhere, on any device, making it easier to share them with others.
Types of Digital Annual Reports:
There are many ways to design a digital annual report. The format you choose should match your company’s style and goals. Here are a few options:
PDF Reports
PDF reports are the easiest and simplest to create. They can be distributed easily via email, or you can turn your PDF files into a link and share them through any communication channel.
You can add pictures, graphs, texts, and minimal design to this report if you don’t want to keep it only text based.
PDF Reports can be the best format if you want to share them with a limited audience or have them on your archive library on your website. It can be shared quickly and also allows you to print if needed and will be displayed in the same style it was created on any devices used.
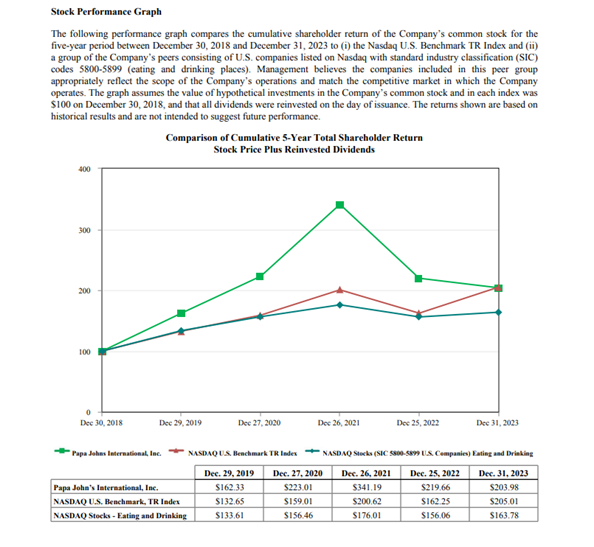
For reference, see this annual report created by Papa John’s International. Their annual report is mainly text-based, but they have added tables and graphs to their report in the section where they talk about the stock performance.
In contrast, Keshet has an Annual Report, which is more visual and colorful. They have many pictures as well as maps, making it lively and engaging.

Interactive Reports
Interactive Reports are the way to go if you want to showcase the projects that were done throughout the year through videos and links. These reports can be PDFs with a few interactive elements or even dedicated websites. It is easy to update, analytics can be tracked, and it can be made SEO-friendly to increase visitors.
For example, a simple way to upgrade the PDF to interactive version could be hyperlinking sections in the Table of content section. Moreover, you can create QR codes for any vital website that you created or add hyperlinks to redirect to another page. You can include interactive timelines, multimedia galleries, and embedded charts. Add password protection if needed for private reports.
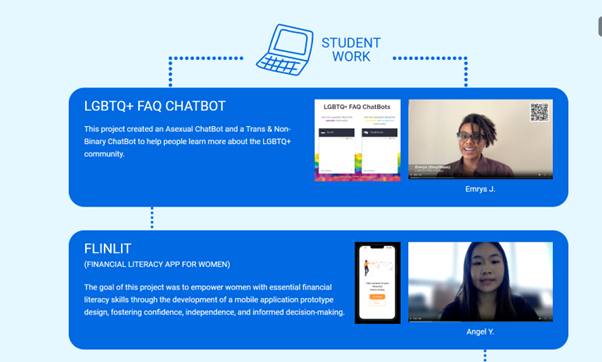
A good example of this can be seen in Girls Who Code’s annual report, where they have multiple students’ work showcased, clicking on which takes you to the project’s page or YouTube video featuring the students who learned and built their work after joining Girls Who Code.
Video Reports
A short, professionally produced video summarizing the report is best for telling a story and grabbing the attention of stakeholders who prefer visual communication. Apart from sharing it with the stakeholders, it can also be shared in public on social media.
You can add animations to it, explain the changes in the graph, and highlight the key milestones. It is best to pair with other formats like digital PDF copy or microsite for reaching different kinds of stakeholders.
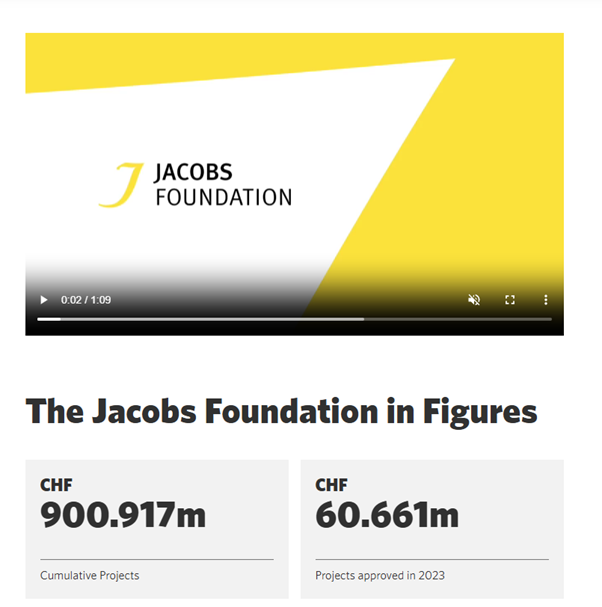
Jacobs Foundation has video video-based annual report along with the website that also has the details present.
Presentation Style Reports
These are the presentations created using various online tools that can be further shared in the link format.
Presentations are the best type when doing internal presentations or pitching to investors. Make sure to make the presentation interactive and link internally and to external sources.
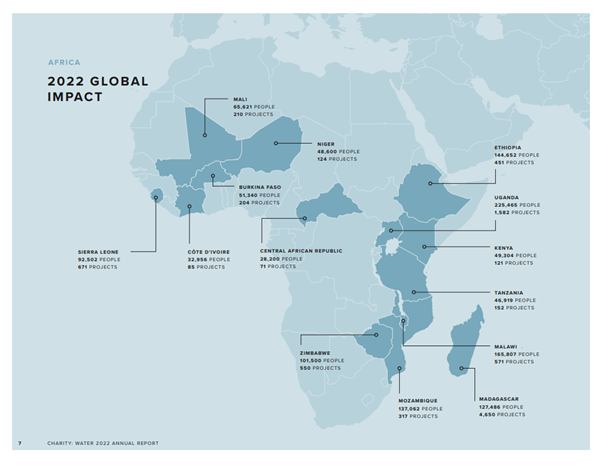
Charity: Water has a presentation style PDF report which highlights their impact through the year.
Social Media First Reports
Companies with a strong presence on social media or who want to catch the public’s attention can create a series of posts, carousels, or short videos summarizing the report highlights.
How to Create a Digital Annual Report
Define the Purpose and Audience
Start by deciding why you’re creating the report and who it’s for. It could be to attract investors, engage employees, inform customers, or reach a mix of stakeholders. Knowing your audience will help you decide what to include and how to present it.
Create a Logical Structure
Structure your report clearly. Start with a cover page that includes your company name, logo, and the year of the report. Further, include a table of contents to provide a clear outline and make it easy to navigate.
Collect all the necessary information, such as financial data, performance metrics, and stories of impact.
You can consider adding sections like:
- Executive summary
- Financial statements
- Notable achievements
- Organizational Impact
- Future goals and strategies
- Acknowledgements, Credits, and Contact information.
You can tailor the sections needed as per your company. Here is an example of a Table of contents from the annual report of Salesforce.
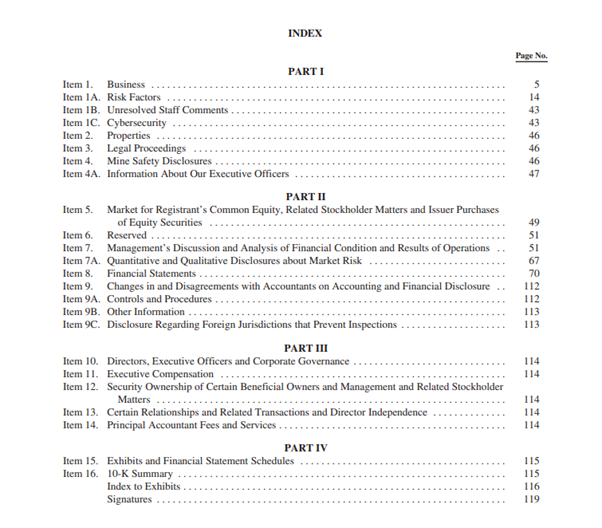
Choose the Right Format
Pick a format that works best for your needs. PDFs are simple and effective, while interactive websites or videos are better for engagement. Choose a style that fits your company’s branding and goals. A lot of formats have been discussed in the previous section, you can choose one of them.
Focus on Design
Good design is essential for a professional and engaging digital annual report. Use a consistent color scheme, typography, and branding elements that align with your organization’s identity.
Prioritize readability by using plenty of white space, a clean layout, and clear headings. Include high-quality visuals such as charts, graphs, and photos to make data more digestible. For digital formats, incorporate interactive elements like clickable navigation, embedded videos, or dynamic charts.
Write with Clarity
Use simple, clear language and avoid jargon. Highlight important points with summaries and use headings to break up text. Make financial data easy to understand by using visuals like graphs. Adding a message from leadership can give the report a personal touch.
Publish it Online
Once your report is ready, choose a platform to host it. A tool like Tiiny.host makes it simple to upload and share your report. You can even protect your digital annual report with a password if needed.
Tiiny host allows various formats to be hosted within seconds and that too without any charges. If you upgrade to one of their pro plans, you get access to additional features like adding a custom domain, tracking analytics, or protecting your reports using a password.
It only takes a few steps to host and share your digital annual report:
- Navigate to Tiiny host’s homepage
- From the webpage, you can easily upload your file
- Once uploaded, give a preferred name for the link to be created for your hosted report
- Login or Signup and hit publish!
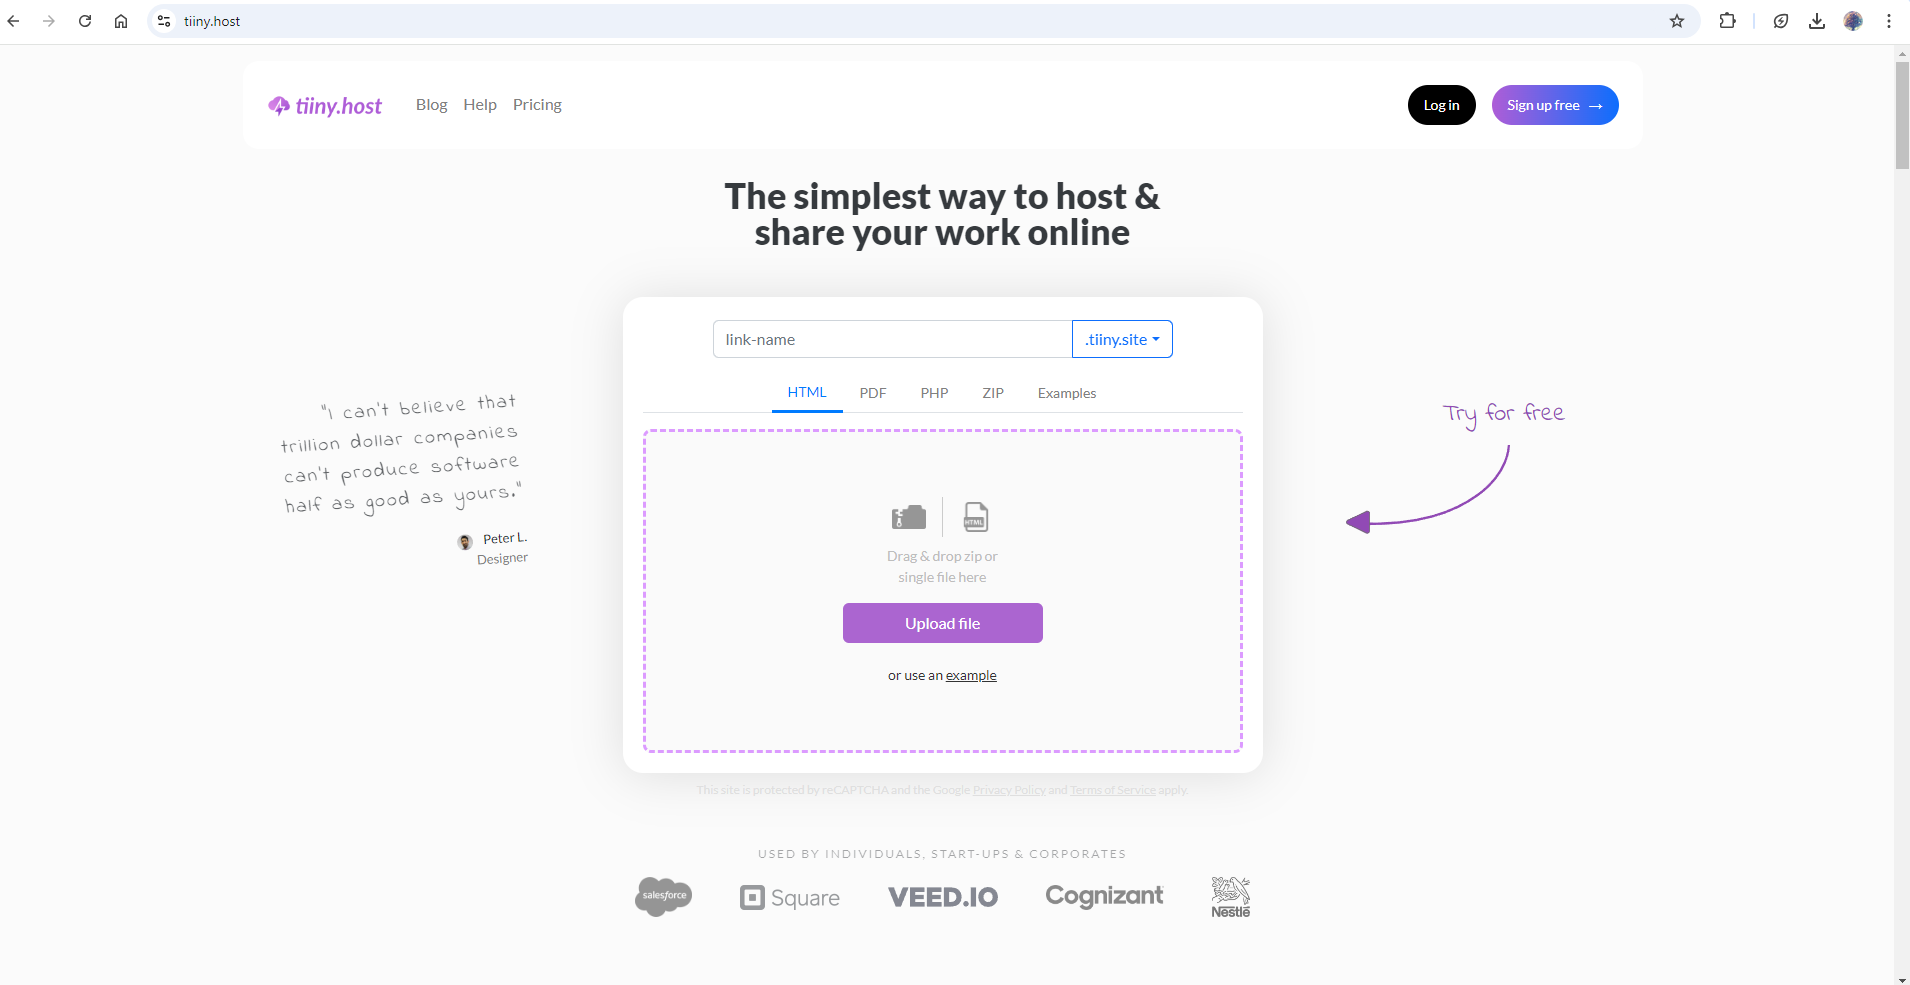
It is that easy to publish with Tiiny! Once published, you can copy the link and share it with anyone anytime.
Tips for making an impactful Annual Report
Make It Accessible
Use simple, jargon-free language to ensure all readers can understand. Include a glossary for technical terms, if necessary. Ensure the design accommodates readers with disabilities (e.g., large fonts, high contrast).
Use Quotes and Testimonials
Include quotes from stakeholders, employees, or beneficiaries. Use these testimonials to humanize your organization’s achievements.
Include Forward-Looking Statements
Highlight strategic goals and upcoming projects. Discuss plans to address challenges or capitalize on opportunities. Use this section to inspire confidence in the organization’s future.
Present Data Effectively
Use visuals like charts, graphs, and tables to make financial data easier to understand. Highlight key metrics and year-over-year trends. Include benchmarks or comparisons to industry standards for context.
FAQs:
How long should a digital annual report be?
There’s no fixed length, but aim to balance detail with brevity. A comprehensive digital annual report can range from 10 to 30 pages, depending on the depth of your organization’s activities and data.
How can I make my digital annual report accessible to a global audience?
To make your report accessible worldwide, host it on a reliable and fast-loading platform like Tiiny.host. Use simple, clear language that avoids region-specific jargon, and consider adding translations for key sections if you cater to a multilingual audience.
How can I include stakeholder feedback in my digital annual report?
Collect feedback through surveys or interviews with stakeholders and include quotes or testimonials in relevant sections. You can also create a “Feedback Highlights” section to showcase how their input influenced decisions.


