- How Do I get Power BI for my Windows computer?
- Importing data into Power BI
- The Power BI desktop visualization interface
- Visualizing your data
- What are Filters?
- Final Steps before exporting Power BI reports as PDF
- Exporting Power BI to PDF
- How to share your PDF online
Power BI is a Microsoft business intelligence and information visualization tool. Exporting Power BI visualizations to PDF is an easy task once you have imported your data and created the visualizations you want.
To immediately skip ahead to the PDF exporting feature description, scroll down to the Exporting Power BI to PDF subheading below.
But first, I’ll describe how to get Power BI, what it does, and how you can use and share the visualizations and reports it generates.
How Do I get Power BI for my Windows computer?
Power BI Desktop is available for Windows computers. At this time, there is no Macintosh version available. However, you can run the Windows version of Power BI desktop on a Mac with a Windows emulator program such as Parallels.
Power BI Desktop is a free application. Here is the main download page for Power BI Tools and Apps. You can download Power BI Desktop directly by searching for it in the Microsoft Store.
Power BI is also available as a service. A Microsoft business account is required for service access.
Importing data into Power BI
After installation, import your tabular data and turn it into attractive presentations.
Get data from:
- Excel workbooks
- Power BI datasets
- XML
- JSON
- PDFs
- SharePoint folders
- Oracle/MySQL/PostgreSQL databases
- Google/Adobe Analytics
- QuickBooks Online
- Dataflows
- SQL Server databases
- Azure Analysis Services databases
- Text/CSV files
- Web pages
- OData feeds
- Blank queries
- And many more…
Of course, you know best what data sources you must import and visualize. A “Get Data” dialog box is available with over 150+ data source types. Odds are, you’ll find the data connection you need
The Power BI desktop visualization interface
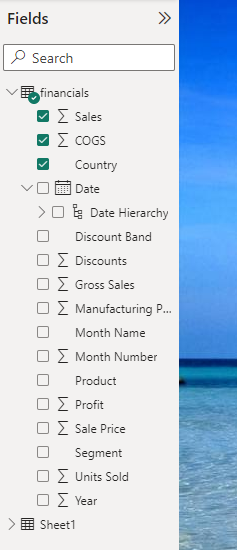
The Power BI desktop interface is divided into three distinct action panels, plus the visual report canvas.
1. Fields, which give you access to your data source fields (this example uses sample data already imported).
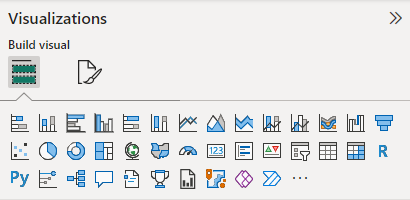
2. Visualizations, which display your data in various graphic formats.
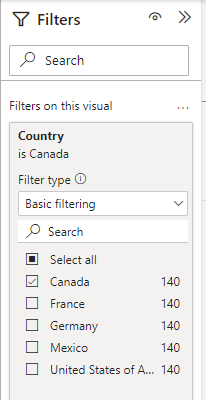
3. Filters, which let you search and format your visualizations and data.
Please refer back to these images for the following descriptions.
Visualizing your data
As you can see from the above images, there are many chart types available to help you display your data visually. Note also that advanced users and programmers can apply R and Python scripts to their data to create custom reporting features.
To visualize a specific set of fields, use the Fields action panel to choose records from the data fields by selecting them with the checkboxes.
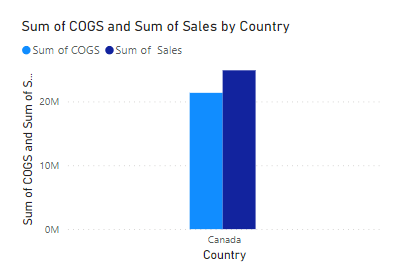
As you select data fields, a chart is generated in the Visualization Canvas. As you add or subtract fields or change the chart type, the result is updated in the new graphic.
The graphics generated on the Canvas are interactive. You can click on them to highlight specific bars or lines on the chart. Also, popup fields give you numeric information on the field clicked or hovered over.
What are Filters?
Filters give you control over every display detail, such as:
- Text font and color
- Icons
- Headers and Footers
- Borders
- Backgrounds
Filters also let you search and select specific information to create new visualizations.
Result:
There are almost limitless variations on display and data filtering available through the Power BI Desktop interface. I can’t cover them all here. Download and play around with the application locally on your computer. Once imported, your original data is safe and will not be edited or deleted. You can experiment freely without worrying that you’ll lose crucial data.
Final Steps before exporting Power BI reports as PDF
You may have one or many visualizations on your canvas. Click and drag each to align them on the canvas as you want them to appear in your PDF report. Like many graphics programs, there are helper guides for aligning the individual graphs on the page. The guides show up as thin red lines and indicate whether the top, sides, center, or bottom of the charts are aligned.
When you are satisfied with your visual presentation, you can export and share it in a couple of ways, including PDF.
Exporting Power BI to PDF
Just like importing or getting data, there are choices in how to export and share your Power BI report. In fact, there are only two choices, making export to PDF quite simple.
Choose File>Export>Export to PDF.
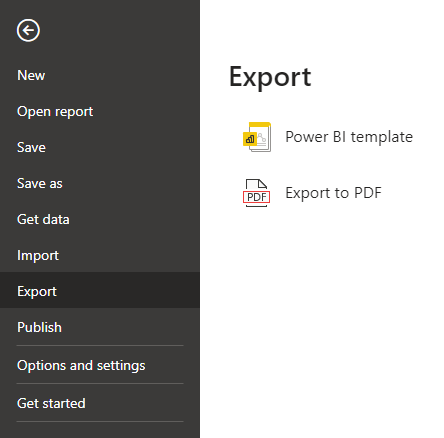
The only other choice is Power BI Template, if you wish to save your current report as a starting point for future reports.
The report will be exported directly without a “Save…” dialog box. I view this as an inconvenience because you may wish to change the location to which you save your PDF. Power BI provides detailed Options and Settings, but I couldn’t find an editable setting for the output path for exporting. Perhaps this is just an oversight.
How to share your PDF online
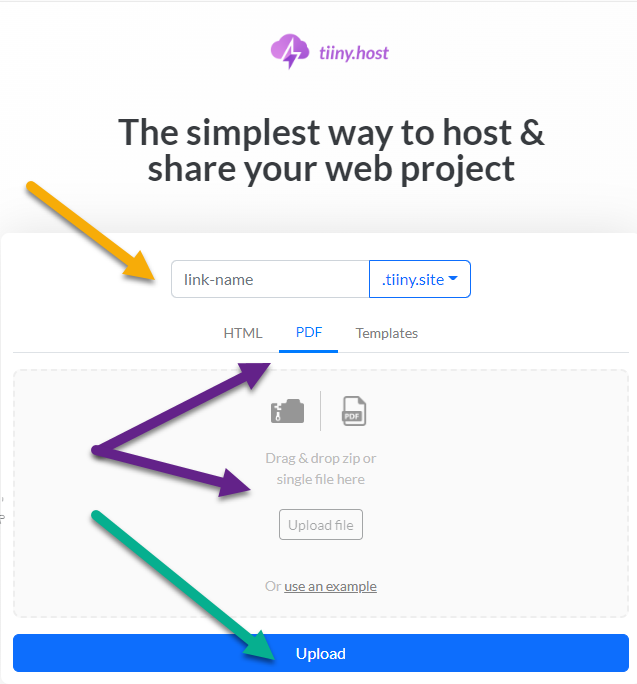
Tiiny.host is the easiest and quickest way to share your PDFs online, whether created by Power BI or any other PDF generator.
Making your PDF live on the web takes only a minute or so.
The three-step process is this:
- Provide a link-name for the PDF’s web address. The final URL will be link-name.tiiny.host.
- Choose the PDF option and upload your PDF to Tiiny.host using either drag and drop or using the upload file button.
- Click the big, blue Upload button, and you’re done.
That’s it! You can host and share your PDF for free.

To share your PDF indefinitely, you can upgrade to a Solo or Pro account. Added features with all paid subscriptions include password protection, site visitor statistics, and more.
Visit Tiiny.host to share your PDF for free and to learn more about available options. You can contact Tiiny.host’s awesome customer service at Tiiny.host/help. Reach them through either chat or email today.

